| FAQs |
|
|
Is there an overview of StarMine's Analyst Performance Measurement Methodology? For a two-page summary of StarMine's Analyst Performance Measurement Methodology, click here. StarMine offers you two ways to treat market cap when viewing analyst recommendation performance:
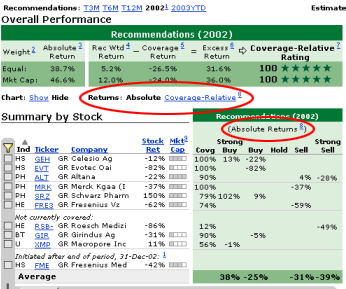
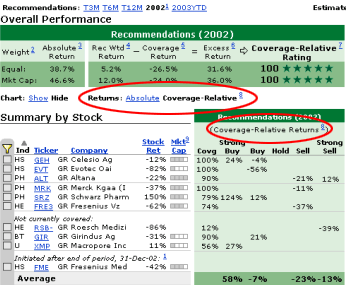
StarMine's Absolute Return metric rewards analysts with a good sense for the overall direction of the individual stocks in their portfolios. Absolute Return assumes that a "Buy" recommendation corresponds to an analyst expectation that the stock will have a positive absolute return and a "Sell" recommendation a negative absolute return; that is, cash is the benchmark. StarMine measures how much investors would have made had they built a portfolio around the analyst's picks by investing 2 units of local currency in each Strong Buy recommendation, 1 unit in each Buy, 1 unit in cash for each Hold, short selling 1 unit in each Sell, and short selling 2 units in each Strong Sell. Each portfolio is rebalanced at the end of every month and each time the analyst adds or drops coverage or changes a recommendation within the portfolio. Recommendation-Weighted Return is computed as a non-leveraged, long-only portfolio of all stocks in an analyst's coverage using an overweight / equal-weight / underweight strategy. StarMine invests 4 units of local currency in each Strong Buy recommendation, 2 units in each Buy, 1 unit in each Hold, ½ unit in each Sell, and ¼ unit in each Strong Sell. The portfolio is rebalanced each month and whenever the analyst adds coverage, drops coverage, or changes a rating. Because the portfolio is constructed using relative weights, it is equally effective for analysts who use three recommendation levels (buy, hold, sell) and for analysts who use five recommendation levels (strong buy, buy, hold, sell, strong sell). A benchmark portfolio return based on holding the universe of stocks covered by the analyst. For the time period indicated (e.g., T12M), a portfolio is constructed by investing equal amounts in each of the stocks on which the analyst had a recommendation. (When viewing performance weighted by market cap the benchmark portfolio is market cap weighted). Each stock is included in the portfolio for the time that the analyst had a recommendation on it. The portfolio is rebalanced at the end of every month and each time the analyst adds or drops coverage. StarMine's Excess Return measures how well analyst recommendations distinguish among the stocks in the analyst's coverage universe. For example, do the Strong Buys outperform the Buys, and so on? It is computed as the difference between an analyst's Recommendation-Weighted Return and his Coverage Return. Because the Recommendation-Weighted Return and the Coverage Return are always fully invested, the difference between them, Excess Return, is not subject to the overall direction of the market. Suppose there are two analysts, one covering biotechnology and one paper. Suppose for the period under consideration, ½ of the biotechnology analyst's stocks were up 10% and ½ were down 10%. Meanwhile, ½ of the paper analyst's stocks were up 5% and ½ were down 5%. If both analysts recommended the stocks they cover perfectly, the Excess Return generated by the biotechnology analyst would be twice that of the paper analyst. If both analysts recommended the stocks they cover perfectly wrong, the Excess Return generated by both analysts would be negative, and that of the biotechnology analyst would again be twice that of the paper analyst. Thus the biotechnology analyst has the opportunity to generate twice the Excess Return that the paper analyst can generate. In order to fairly compare analyst skill across industries with returns with more or less dispersion, StarMine calculates the Coverage-Relative Score and Coverage-Relative Rating. First StarMine divides the Excess Return by the cross-sectional standard deviation of the returns of the stocks the analyst covers. StarMine then sorts all analysts in its database according to the resulting ratio for the given time period and assigns the analyst the corresponding Coverage-Relative Score, which ranges from 1-100. The Coverage-Relative Score is a percentile: 50 means the analyst out-performed 50% of all analysts, 75 means the analyst outperformed 75% of all analysts, etc. The resulting measure isolates the skill of the analyst in distinguishing among the stocks he covers, and is independent of the direction of the market and the variance across the particular stocks. StarMine awards the Coverage-Relative Rating by awarding 5 stars to analysts with Coverage-Relative Scores 91-100, 4 stars for 68-90, 3 stars for 34-67, 2 stars for 11-33, and 1 star for 1-10. The green-shaded area in the lower-right corner of the screens below displays stock-by-stock details for each recommendation level used by an analyst. For example, the top screen shows that while the analyst had a "Strong Buy" on Celesio AG, the stock was up 13%. StarMine also offers the ability to view stock-by-stock performance relative to the analyst's coverage universe. The screen on the bottom shows that while the analyst had a Strong Buy on Celesio, it was up 24% relative to the analyst's coverage universe at the time. By viewing performances relative to coverage, it is easier to get a better understanding of which stocks and calls contributed the most to an analyst's Excess Return, since it is also computed relative to the analyst's coverage. The Absolute and Coverage-Relative links above the Recommendations table allow you to toggle the view between the two options. The links also toggle the chart between Absolute Return and Coverage-Relative / Excess Return.  
Coverage is the percentage of the displayed time interval (e.g., T12M) that the analyst had a recommendation on the stock. The average or mean return on each respective rating level in the column above. The average return, weighted by market cap, of the stocks in the industry within the region. Industry groups are provided by the Global Industry Classification System (GICS). (More on GICS). StarMine measures analyst recommendation performance and ranks analysts within industries according to the analyst's Industry Excess Return. Industry Excess Return simulates a portfolio that is built around an analyst's recommendations. The benchmark for this portfolio is the market-cap weighted average of the returns of all stocks in the industry. Analysts are rewarded for having "Buy" recommendations on stocks that outperform the industry, and "Sell" recommendations on stocks that underperform the industry. For example, an analyst who has a "Buy" recommendation on a stock that returned 10% in an industry whose average return was 6%, would earn a score equal to the amount the stock outperformed the industry, or 4%. High-ranking analysts are those who are skilled in forecasting the direction of the stocks that they follow, relative to the given industry. When StarMine receives concurrent recommendations or estimates on both stocks, StarMine includes (in your Overall Performance and your Industry Performance) the performance on the stock listed in the company's home country only, and disregards performance on secondary listings such as ADRs. In other words, when you publish a forecast on the home country stock only, we count that. When you publish on the ADR only, we count that. When you publish on them both, we count the home country stock only. We make this decision for each period independently. For example, if you publish estimates for Q1 for the ADR only, for Q2 for the home country stock only, and for Q3 for both stocks, during Q1 we count the ADR, and during Q2 and Q3 we count the home country stock. Likewise, if you publish a recommendation during January for the ADR only, during February for the home country stock only, and during March for both stocks, during January we count the ADR, and during February and March we count the home country stock. Stocks that were not included for all or part of a period (such as T12M) are listed in a separate section titled "Secondary listings (not double-counted)." Generally, analysts drop coverage on stocks whose prices have dropped to very low levels. However, sometimes recommendations are left hanging. StarMine has found that price moves by these low-priced stocks can be enormous in percentage terms and can dramatically affect the analyst's performance results and the overall rankings. Therefore, when a stock falls below a certain price threshold, which StarMine sets separately for each currency, StarMine does not include the stock in computing the portfolio return. The thresholds by currency are:
|