| FAQs |
|
|
What is a Relative Accuracy Score (RAS)?
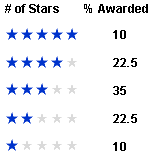
Typically indicated both by a StarRating and a numerical score, Relative Accuracy Score (RAS) is a measure that compares analysts against their peers. RAS ranges from 0 to 100, with 50 representing the average analyst. To get a number larger than 50, an analyst must make estimates that are both different from and more accurate than other analysts' estimates. RAS takes into account many factors including the analyst's absolute forecast error, the analyst's error compared to other analysts, the variance of the analyst's errors, and the absolute value of the stock's actual reported value. StarMine computes RAS daily to provide an overall score for an analyst on a stock or group of stocks. StarMine converts a RAS to a StarRating™ by awarding the top ten percent of analysts a 5-StarRating, the next 22.5% a 4-StarRating, and so on, as detailed in the following chart:  Your performance is based on the relative accuracy of your estimates versus reported actuals, the relative accuracy of the consensus versus reported actuals, and the aggregate of your performance across multiple stocks and periods. We measure analysts according to how far their estimates vary from the reported actual and the consensus on a daily basis, then determine a "Relative Accuracy Score™" for every day an estimate is valid. We then average over the days within a fiscal period (91 for quarters, and 365 for years) and aggregate over the total number of periods you covered a particular stock in order to give you an overall score. We do not take the simple average of performance across all quarters. Instead, we utilize an algorithm that accounts for the length of time a stock was covered during a period (by quarter or year), and the number of stocks covered. This algorithm produces the most effective method of evaluating individual analysts in a firm. The reason we do not use the simple average is that it is more difficult to be consistently above average than it is to be sporadically above average. For example, if the average score is 60 over ten periods, the overall Relative Accuracy Score™ is 81. The reasoning is that the analyst is consistently better than average. However, if the average Relative Accuracy Score™ of an analyst is 40 over ten periods, the overall Relative Accuracy Score™ is 18. Since analysts publish both quarterly and full year estimates, we rank analysts on both forecasts. In this case, 4FQ is the performance over the last four quarters of estimates, whereas 1FY is the performance for estimates on the last fiscal year. The stars are a visual method of representing relative analyst estimating performance. We utilize a bell-shaped curve, so approximately 10% of the analysts get 5-stars; 10% get 1-star; 22.5% get 2-stars; 22.5% get 4-stars; the remaining 35% analysts get three stars. The distribution of scores is shown in the chart below.  For a graphic explanation of charts, click here. The top bronze line is the highest estimate for a point in time; the bottom bronze line is the lowest estimate for a point in time. The thick bronze line in the middle is the mean at a point in time. The thick blue line represents the specified analyst's forecast. The black vertical bar to the far right represents the actual value as reported. The vertical dashed purple line signifies a Cluster date. The Average Absolute Error figure summarizes an analyst's estimate error over the course of a given fiscal period. StarMine calculates the Average Absolute Error by first determining an analyst's absolute error for each day in the Evaluation Window (quarters or years) and then averaging the errors for the entire window. Some analysts do not have forecasts during the entire Evaluation Window. In these instances, the Average Absolute Error for that stock is calculated for the days the analyst had an estimate. When StarMine receives concurrent recommendations or estimates on both stocks, StarMine includes (in your Overall Performance and your Industry Performance) the performance on the stock listed in the company's home country only, and disregards performance on secondary listings such as ADRs. In other words, when you publish a forecast on the home country stock only, we count that. When you publish on the ADR only, we count that. When you publish on them both, we count the home country stock only. We make this decision for each period independently. For example, if you publish estimates for Q1 for the ADR only, for Q2 for the home country stock only, and for Q3 for both stocks, during Q1 we count the ADR, and during Q2 and Q3 we count the home country stock. Likewise, if you publish a recommendation during January for the ADR only, during February for the home country stock only, and during March for both stocks, during January we count the ADR, and during February and March we count the home country stock. Stocks that were not included for all or part of a period (such as T12M) are listed in a separate section titled "Secondary listings (not double-counted)." |